Evolutionary Coupling Analysis
Predicted and experimental contacts
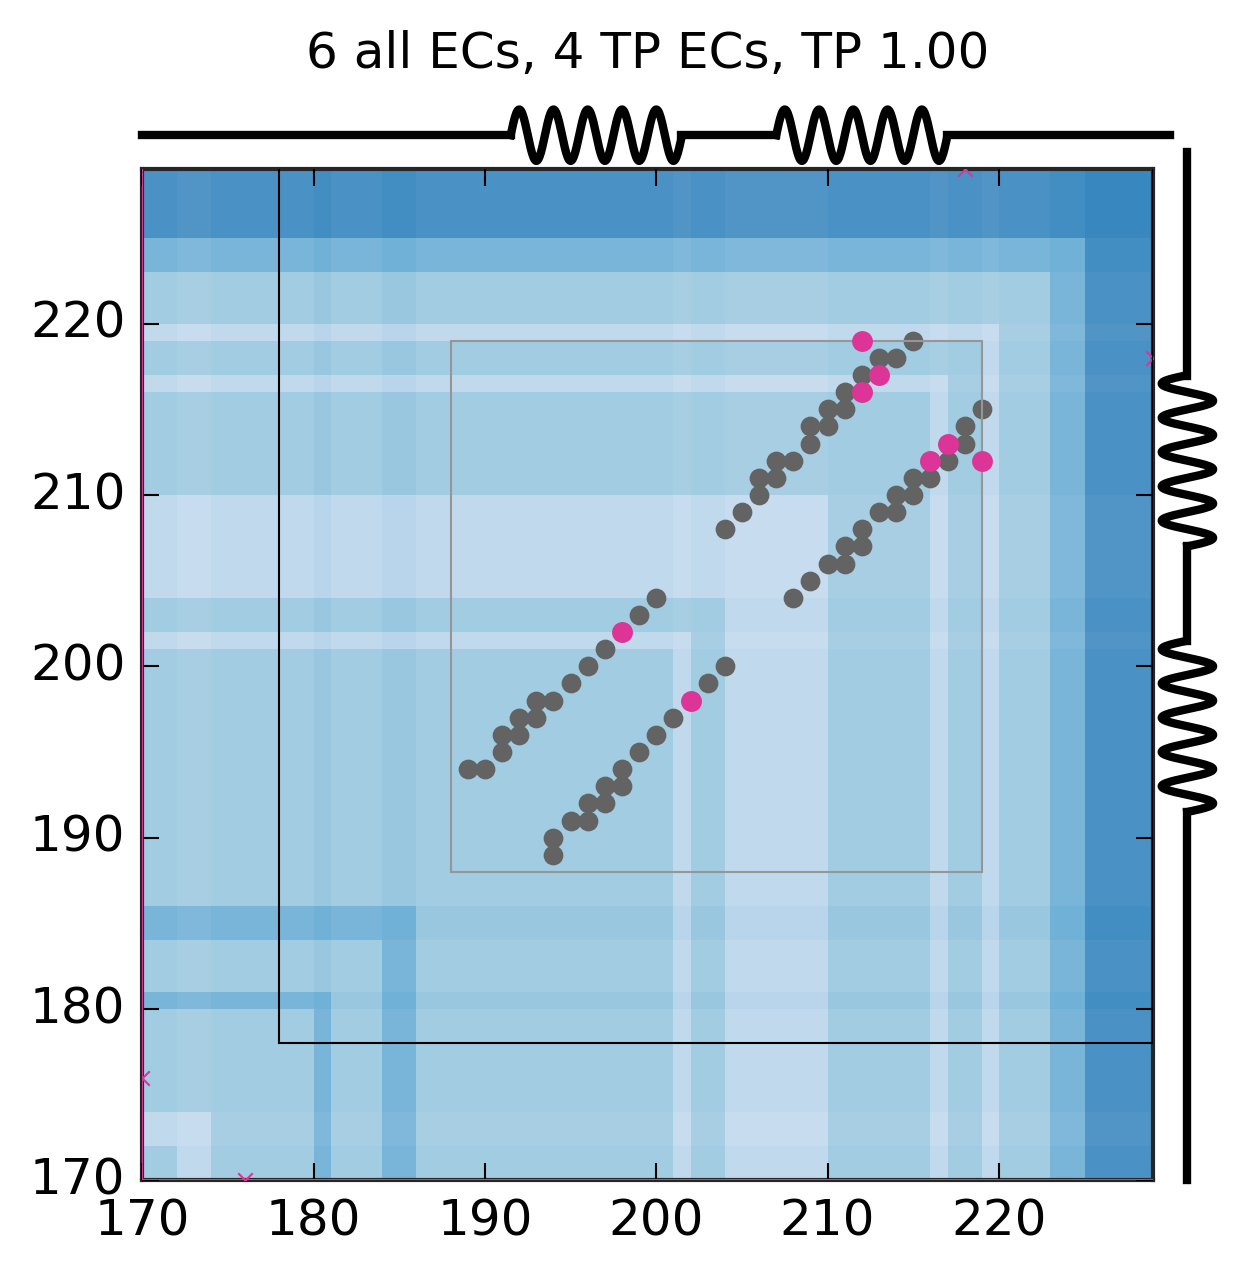
Interactive contact map
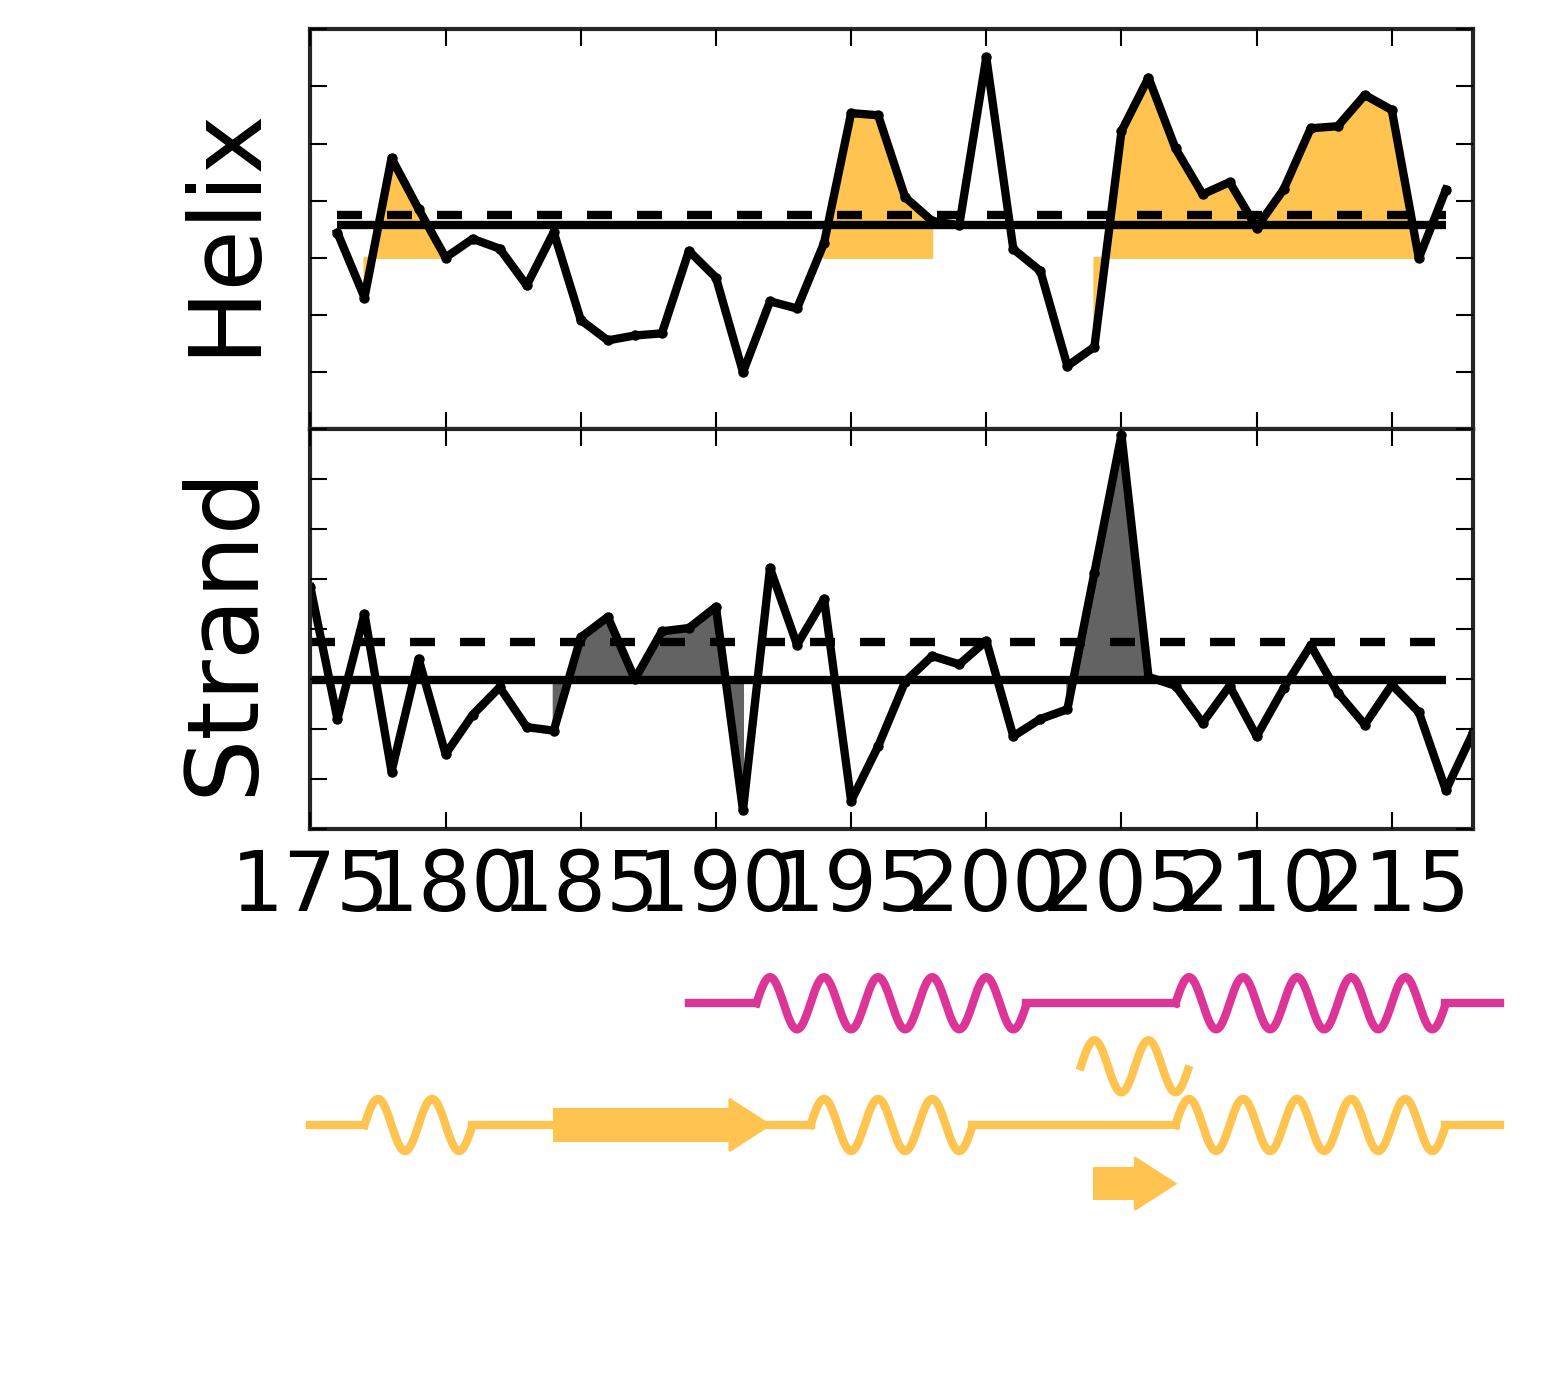
Secondary structure from ECs
Known pdb structures
| pdb | chain |
|---|---|
| 2jtt | C |
EC score distribution and threshold

Top ECs
| Rank | Residue 1 | Amino acid 1 | Residue 2 | Amino acid 2 | EC score |
|---|---|---|---|---|---|
| 1 | 198 | K | 202 | D | 0.56 |
| 2 | 213 | K | 217 | E | 0.53 |
| 3 | 218 | S | 229 | F | 0.42 |
| 4 | 212 | N | 216 | V | 0.40 |
| 5 | 170 | V | 176 | E | 0.36 |
| 6 | 212 | N | 219 | R | 0.33 |
Alignment robustness analysis
First most common residue correlation
Second most common residue correlation
